


Beware Sharpe Ratios for Private Markets
Investors often assess risk/return profiles of assets using Sharpe ratios. Some interpret the ratio, which scales an asset’s return over a risk-free rate by its standard deviation, as a measure of how much return you get per unit of risk. But this interpretation rests heavily on whether return volatility captures real-time changes in the underlying asset values.
Public markets allow assets to trade at continuously updated prices. That means changes in the assets’ fair values are instantaneously expressed through price movements. Non-traded assets, on the other hand, don’t have real-time indicators of their value. The returns are based on periodically updated net asset values (NAVs) that could be stale.
We can see this distinction in the volatility of publicly listed vs. non-listed business development companies (BDC) returns. As we have written in the past, indices of traded BDCs are sometimes used as a public proxy for private credit as these companies primarily purchase private credit debt. Prices of listed BDCs change continuously based on the market’s views. Non-listed BDCs, on the other hand, are not exchange-traded and therefore lack a mechanism to incorporate the market’s views in real time.
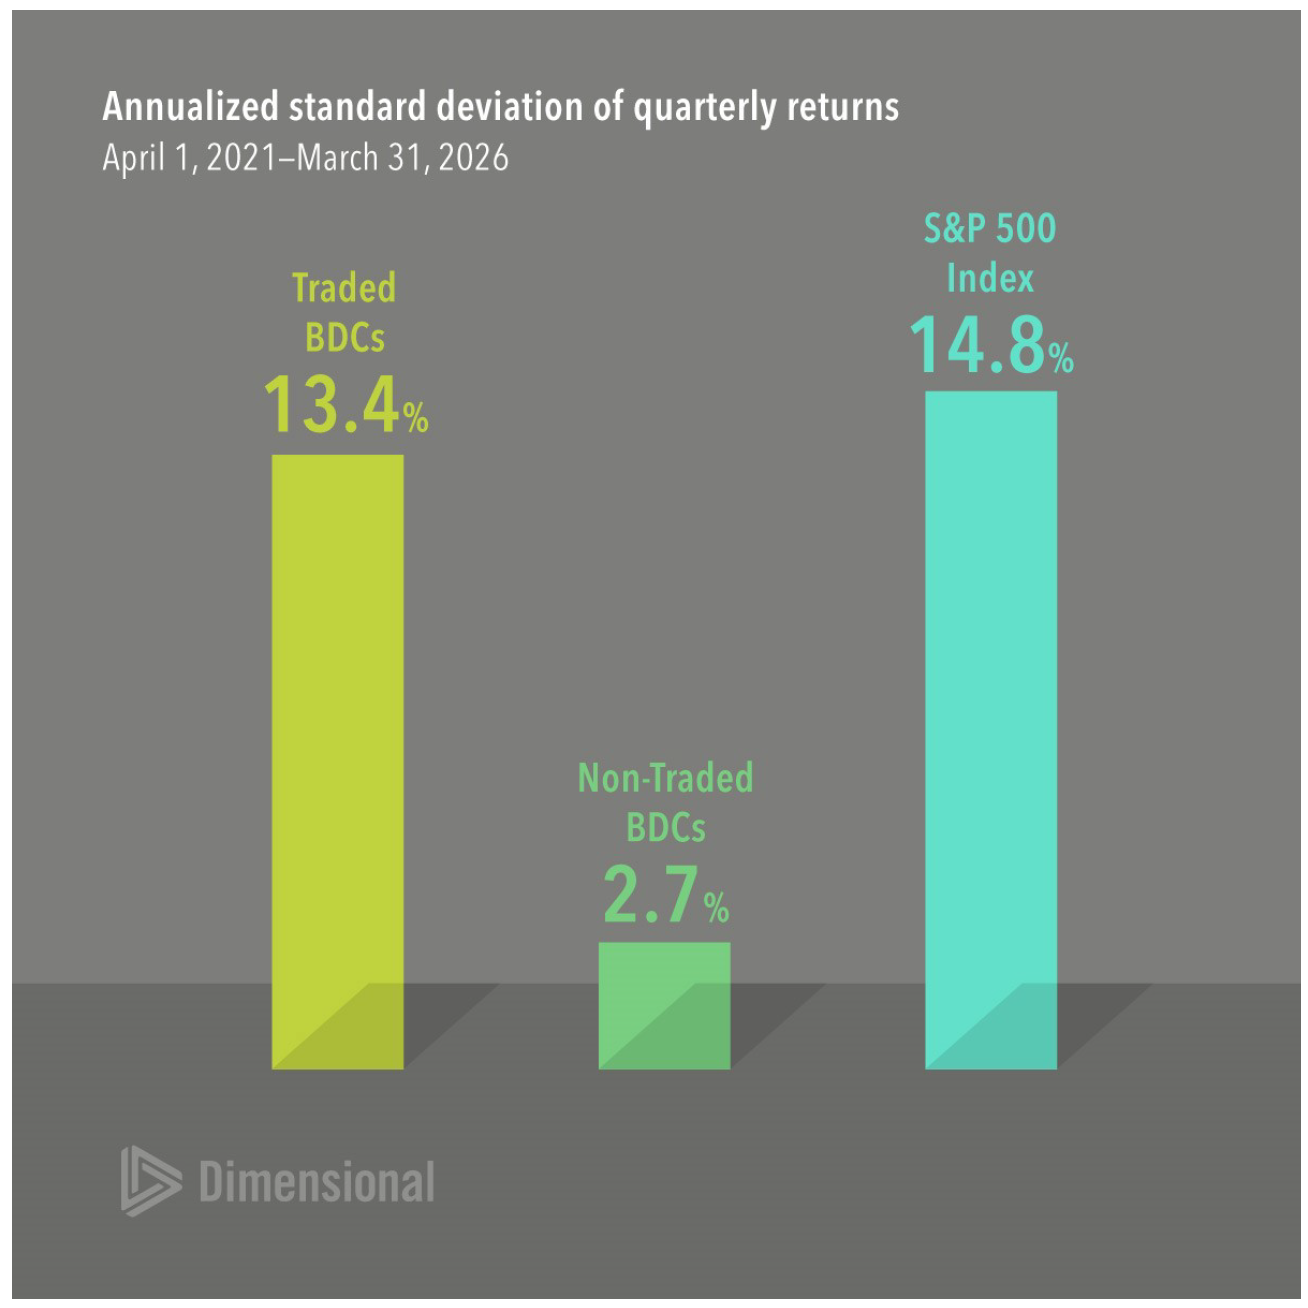
The difference in volatility is not subtle. The annualized standard deviation of quarterly returns over the past five years was 13.4% for publicly traded BDCs versus just 2.7% for non-traded BDCs. And this is despite the fact that the underlying investments are often the same between the two classes of BDCs. This demonstrates the challenge in making sense out of Sharpe ratios calculated for private market strategies.
Past performance is not a guarantee of future results. Actual returns may be lower.
In USD. S&P BDC Total Return Index provided by Morningstar. Non-Traded BDC returns are asset-weighted averages of USD-denominated US domiciled closed-end funds identified as business development companies by Morningstar. When funds have unreported monthly assets, the previous period's assets are projected forward. Indices are not available for direct investment; therefore, their performance does not reflect the expenses associated with the management of an actual portfolio.
Glossary
Business Development Companies: Closed-end funds that primarily purchase private credit debt.
Net Asset Value: The difference between a company's assets and its liabilities.
Private Credit: Loans made to small and midsize businesses by private investment funds.
Standard Deviation: A measure of the variation or dispersion of a set of data points. Standard deviations are often used to quantify the historical return volatility of a security or portfolio.
Disclosures
All expressions of opinion are subject to change. This information is not meant to constitute investment advice, a recommendation of any securities product or investment strategy (including account type), or an offer of any services or products for sale, nor is it intended to provide a sufficient basis on which to make an investment decision. Investors should consult with a financial professional regarding their individual circumstances before making investment decisions. Diversification neither assures a profit nor guarantees against loss in a declining market.
Risks include loss of principal and fluctuating value.
Adaptive Wealth Engineering is an investment advisor registered with the Securities and Exchange Commission.
Investment products: • Not FDIC Insured • Not Bank Guaranteed • May Lose Value
Adaptive Wealth Engineering does not have any bank affiliates.