


Outpacing Inflation with Stocks
US inflation is back in the news this week, as the year-over-year change in the Consumer Price Index is at the highest level since 2023. This may stoke fears of further inflation for many investors.
It’s important to note that expected inflation is incorporated into the expected returns demanded by market participants. To the extent inflation is expected to impact either future cashflows from an investment, or the discount rate applied to these cashflows, market prices adjust to compensate, resulting in positive expected real1 returns.
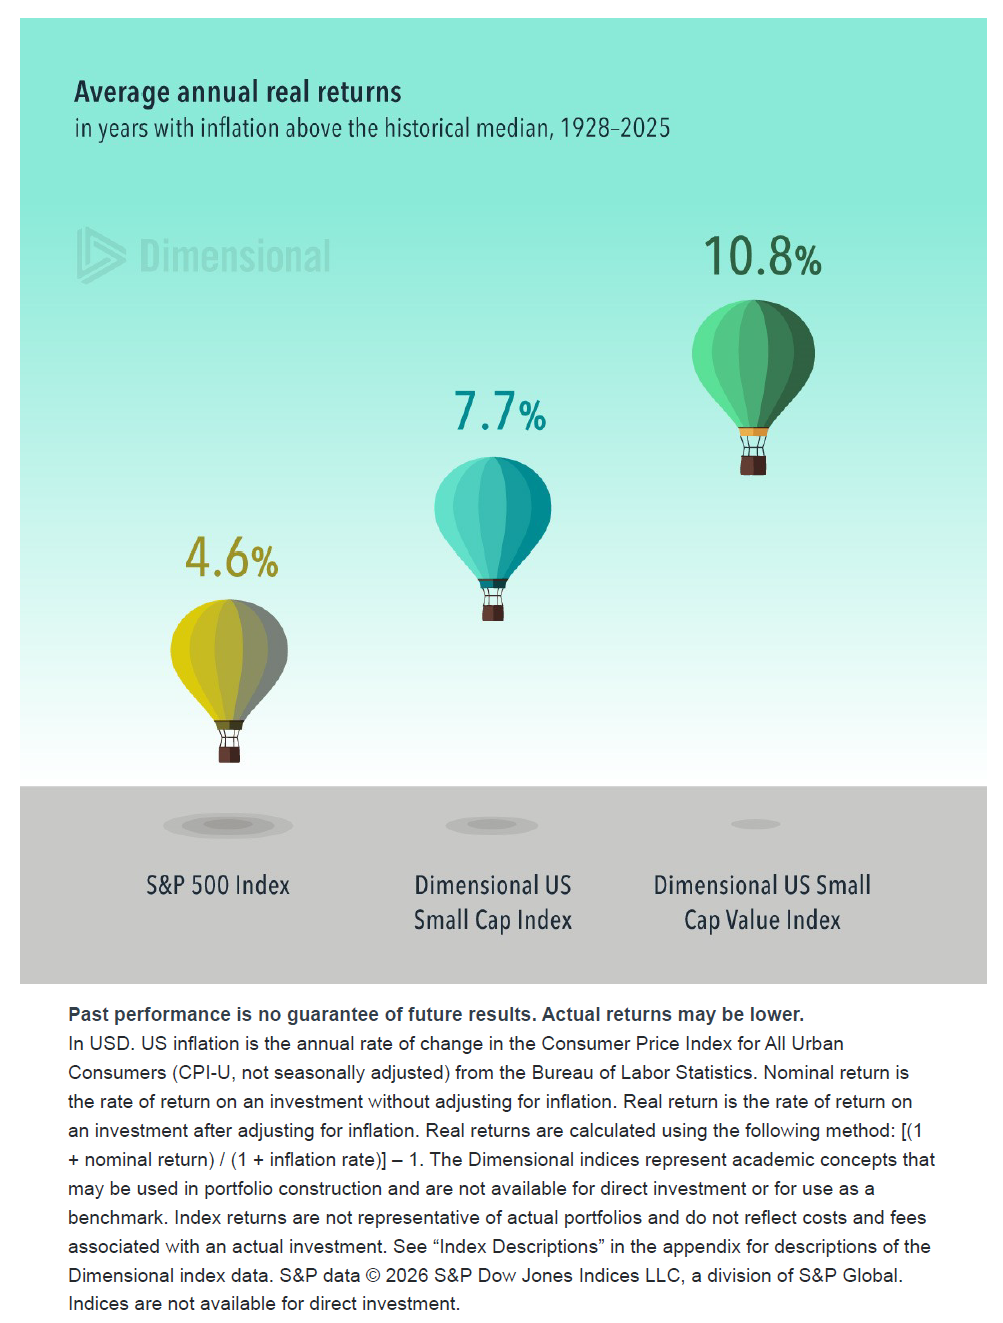
This is borne out in historical data. Average real returns for the broad US stock market, based on the S&P 500 Index, have been positive even in years when inflation was above the historical median. Average real returns for small cap and small cap value stocks have been even higher, implying investors should not shy away from tilting towards higher expected return stocks even if inflation expectations are elevated.
We often say one way for investors to deal with inflation is to outpace it. Stocks have been a good way to do this historically.
1. Real meaning in excess of inflation.
Index Descriptions
The Dimensional Indices have been retrospectively calculated by Dimensional Fund Advisors LP and did not exist prior to their index inception dates. Accordingly, results shown during the periods prior to each index’s inception date do not represent actual returns of the index. Other periods selected may have different results, including losses. Backtested index performance is hypothetical and is provided for informational purposes only to indicate historical performance had the index been calculated over the relevant time periods. Backtested performance results assume the reinvestment of dividends and capital gains. Profitability is defined as operating income before depreciation and amortization minus interest expense divided by book equity. Asset growth is defined as change in total assets from the prior fiscal year to current fiscal year.
Dimensional US Small Cap Index: June 1927 - December 1974: Dimensional US Small Cap Index Composition: Market-capitalization-weighted index of securities of the smallest US companies whose market capitalization falls in the lowest 8% of the total market capitalization of the Eligible Market. The Eligible Market is composed of securities of US companies traded on the NYSE, NYSE MKT (formerly AMEX), and Nasdaq Global Market. Exclusions: Non-US companies, REITs, UITs, and Investment Companies. Source: CRSP and Compustat. January 1975 - Present: Dimensional US Small Cap Index Composition: Market-capitalization-weighted index of securities of the smallest US companies whose market capitalization falls in the lowest 8% of the total market capitalization of the Eligible Market. The Eligible Market is composed of securities of US companies traded on the NYSE, NYSE MKT (formerly AMEX), and Nasdaq Global Market. Exclusions: Non-US companies, REITs, UITs, and Investment Companies and companies with the lowest profitability and highest relative price within the small cap universe. The index also excludes those companies with the highest asset growth within the small cap universe. Source: CRSP and Compustat. The Dimensional US Small Cap Index has been retrospectively calculated by Dimensional Fund Advisors and did not exist prior to March 1, 2007. The index monthly returns are computed as the simple average of the monthly returns of 12 sub-indices, each one reconstituted once a year at the end of each month of the year. The calculation methodology for the Dimensional US Small Cap Index was amended on January 1, 2014 to include profitability as a factor in selecting securities for inclusion in the index. The calculation methodology for the Dimensional US Small Cap Index was amended in December 2019 to include asset growth as a factor in selecting securities for inclusion in the index.
Dimensional US Small Cap Value Index: June 1927 - December 1974: Dimensional US Small Cap Value Index Composition: A subset of the US Small Cap Index. The subset is defined as companies whose relative price is in the bottom 25% of the US Small Cap Index after the exclusion of utilities, companies lacking financial data, and companies with negative relative price. The Eligible Market is composed of securities of US companies traded on the NYSE, NYSE MKT (formerly AMEX), and Nasdaq Global Market. Exclusions: Non-US companies, REITs, UITs, and Investment Companies. Source: CRSP and Compustat. January 1975-Present: Dimensional US Small Cap Value Index Composition: A subset of the US Small Cap Index. The subset is defined as companies whose relative price is in the bottom 35% of the US Small Cap Index after the exclusion of utilities, companies lacking financial data, and companies with negative relative price. The Eligible Market is composed of securities of US companies traded on the NYSE, NYSE MKT (formerly AMEX), and Nasdaq Global Market. Exclusions: Non-US companies, REITs, UITs, and Investment Companies and companies with the lowest profitability within the small cap value universe. The index also excludes those companies with the highest asset growth within the small cap universe. Source: CRSP and Compustat. The Dimensional US Small Cap Value Index has been retrospectively calculated by Dimensional Fund Advisors and did not exist prior to March 1, 2007. The index monthly returns are computed as the simple average of the monthly returns of 12 sub-indices, each one reconstituted once a year at the end of each month of the year. The calculation methodology for the Dimensional US Small Cap Value Index was amended on January 1, 2014 to include profitability as a factor in selecting securities for inclusion in the index. The calculation methodology for the Dimensional US Small Cap Value Index was amended in December 2019 to include asset growth as a factor in selecting securities for inclusion in the index. The calculation methodology for the Dimensional US Small Cap Value Index was amended in November 2025 to limit single-security and sector concentration.
Disclosures
All expressions of opinion are subject to change. This information is not meant to constitute investment advice, a recommendation of any securities product or investment strategy (including account type), or an offer of any services or products for sale, nor is it intended to provide a sufficient basis on which to make an investment decision. Investors should consult with a financial professional regarding their individual circumstances before making investment decisions. Diversification neither assures a profit nor guarantees against loss in a declining market.
Risks include loss of principal and fluctuating value.
Adaptive Wealth Engineering is an investment advisor registered with the Securities and Exchange Commission.
Investment products: • Not FDIC Insured • Not Bank Guaranteed • May Lose Value
Adaptive Wealth Engineering does not have any bank affiliates.