


A Surprise Winner Among Asset Classes
When I started at Dimensional back in 2010, international stocks were a popular topic.That might have had something to do with the “lost decade” in which the S&P 500 Index posted a negative return.1 More recently, stoking interest in non-US investing has been like pulling teeth. Again, this was mostly tied to recent S&P 500 performance, which from 2011–2020 was tops among global stock categories. But something tells me international investments may be at the forefront again soon.
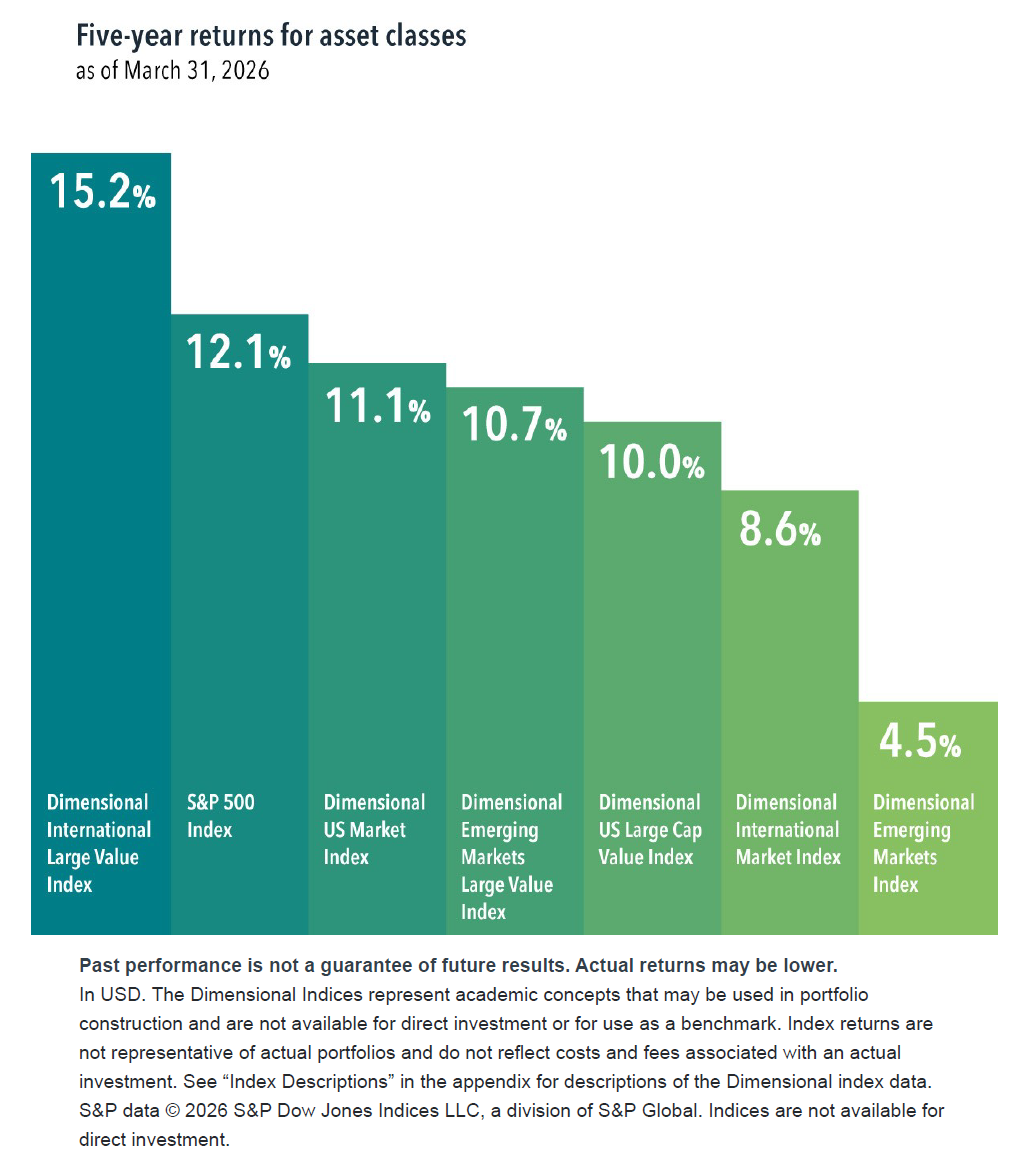
I have to admit that the recent five-year asset class return numbers snuck up on me, sort of like the popular Jason Momoa vs. Henry Cavill meme. While the S&P remained near the top, non-US developed market value stocks quietly led among equity asset classes over this stretch. I can’t imagine many investors saw that coming, but it’s a good reminder of the challenge in predicting
which markets will outperform.
1. From January 2000–December 2009, the S&P 500 Index annualized return was –0.95%.
Index Descriptions
The Dimensional Indices have been retrospectively calculated by Dimensional Fund Advisors LP and did not exist prior to their index inception dates. Accordingly, results shown during the periods prior to each index’s inception date do not represent actual returns of the index. Other periods selected may have different results, including losses. Backtested index performance is hypothetical and is provided for informational purposes only to indicate historical performance had the index been calculated over the relevant time periods. Backtested performance results assume the reinvestment of dividends and capital gains. Profitability is defined as operating income before depreciation and amortization minus interest expense divided by book equity. Asset growth is defined as change in total assets from the prior fiscal year to current fiscal year.
Dimensional International Large Value Index was created in April 2008. January 1990–Present: Consists of large cap companies in eligible markets whose relative price is in the bottom 30% of their country’s large companies, after the exclusion of utilities and companies with either negative or missing relative price data. The index emphasizes companies with smaller capitalization, lower relative price, and higher profitability. The index also excludes those companies with the lowest profitability within their country’s large value universe. Profitability is defined as operating income before depreciation and amortization minus interest expense divided by book equity. The index monthly returns are computed as the simple average of the monthly returns of four sub-indices, each one reconstituted once a year at the end of each quarter of the year. Maximum index weight of any one company is capped at 5%. Countries currently included are Australia, Austria, Belgium, Canada, Denmark, Finland, France, Germany, Hong Kong, Ireland, Israel, Italy, Japan, Netherlands, New Zealand, Norway, Portugal, Singapore, Spain, Sweden, Switzerland, and United Kingdom. Exclusions: REITs and Investment Companies. Source: Bloomberg. The calculation methodology was amended in January 2014 to include profitability as a factor in selecting securities for inclusion and in November 2025 to limit sector concentration.
Dimensional US Market Index was created in March 2007. June 1927–Present: Market-capitalization-weighted index of securities of all US companies. The eligible market is composed of securities of US companies traded on the NYSE, NYSE MKT (formerly AMEX), and Nasdaq Global Market. Exclusions: Non-US companies, REITs, UITs, and Investment Companies. Source: CRSP and Compustat.
Dimensional Emerging Markets Large Value Index was created in April 2008. January 1994–Present: Consists of large cap companies in eligible markets whose relative price is in the bottom 30% of their country’s large companies, after the exclusion of utilities and companies with either negative or missing relative price data. The index emphasizes companies with smaller capitalization, lower relative price, and higher profitability. The index also excludes those companies with the lowest profitability within their country’s large value universe. Profitability is defined as operating income before depreciation and amortization minus interest expense divided by book equity. The index monthly returns are computed as the simple average of the monthly returns of four sub-indices, each one reconstituted once a year at the end of each quarter of the year. Maximum index weight of any one company is capped at 5%. Countries currently included are Brazil, Chile, China, Colombia, the Czech Republic, Greece, Hungary, India, Indonesia, Kuwait, Malaysia, Mexico, Peru, the Philippines, Poland, Qatar, Saudi Arabia, South Africa, South Korea, Taiwan, Thailand, Turkey, and the UAE. Exclusions: REITs and Investment Companies. Source: Bloomberg. The calculation methodology was amended in January 2014 to include profitability as a factor in selecting securities for inclusion and in November 2025 to limit sector concentration.
Dimensional US Large Cap Value Index was created in March 2007. June 1927–December 1974: Consists of large cap companies in the eligible market whose relative price is in the bottom 25% of the US Large Cap Index after the exclusion of utilities, companies lacking financial data, and companies with negative relative price. The eligible market is composed of securities of US companies traded on the NYSE, NYSE MKT(formerly AMEX), and Nasdaq Global Market. Exclusions: Non-US companies, REITs, UITs, and Investment Companies. Source: CRSP and Compustat. January 1975–present: Consists of large cap companies in the eligible market whose relative price is in the bottom 30% of large cap market after the exclusion of utilities, companies lacking financial data, and companies with negative relative price. The Index emphasizes securities with higher profitability, lower relative price, and lower market capitalization. The eligible market is composed of securities of US companies traded on the NYSE, NYSE MKT (formerly AMEX), and Nasdaq Global Market. Exclusions: Non-US companies, REITs, UITs, and Investment Companies. Source: CRSP and Compustat. The index monthly returns are computed as the simple average of the monthly returns of 12 sub-indices, each one reconstituted once a year at the end of each month of the year. The calculation methodology for the index was amended on January 1, 2014 to include profitability as a factor in selecting securities for inclusion in the index. The calculation methodology for the index was amended in November2025 to limit single-security and sector concentration.
Dimensional International Market Index was created in April 2008. January 1975–Present: Market cap-weighted index of all securities in the eligible markets. The index monthly returns are computed as the simple average of the monthly returns of four sub-indices, each one reconstituted once a year at the end of each quarter of the year. Maximum index weight of any one company is capped at 5%. Countries currently included are Australia, Austria, Belgium, Canada, Denmark, Finland, France, Germany, Hong Kong, Ireland, Israel, Italy, Japan, Netherlands, New Zealand, Norway, Portugal, Singapore, Spain, Sweden, Switzerland, and United Kingdom. Exclusions: REITs and Investment Companies. Source: Bloomberg.
Dimensional Emerging Markets Index was created in April 2008. January 1990–present: Market cap-weighted index of all securities in the eligible markets. Maximum index weight of any one company is capped at 5%. Countries currently included are Brazil, Chile, China, Colombia, the Czech Republic, Greece, Hungary, India, Indonesia, Kuwait, Malaysia, Mexico, Peru, the Philippines, Poland, Qatar, Saudi Arabia, South Africa, South Korea, Taiwan, Thailand, Turkey, and the UAE. Exclusions: REITs and Investment Companies. Source: Bloomberg. The index monthly returns are computed as the simple average of the monthly returns of four sub-indices, each one reconstituted once a year at the end of each quarter of the year.
Disclosures
All expressions of opinion are subject to change. This information is not meant to constitute investment advice, a recommendation of any securities product or investment strategy (including account type), or an offer of any services or products for sale, nor is it intended to provide a sufficient basis on which to make an investment decision. Investors should consult with a financial professional regarding their individual circumstances before making investment decisions. Diversification neither assures a profit nor guarantees against loss in a declining market.
Risks include loss of principal and fluctuating value.
Adaptive Wealth Engineering is an investment advisor registered with the Securities and Exchange Commission.
Investment products: • Not FDIC Insured • Not Bank Guaranteed • May Lose Value
Adaptive Wealth Engineering does not have any bank affiliates.